

University of Barcelona MosaicTool
Data extraction and processing workflow for RGB, VNIR and TIR UAV crop phenotyping.
Step by step instructions on the use of the University of Barcelona MosaicTool plugin for FIJI
(Copyright S.C. Kefauver, University of Barcelona, Spain, 2018)
- Open the software package FIJI (by double clicking on the x32 or x64 icon in the download folder).
Download and install Java, FIJI and the MosaicTool Plugin as follows:
- Install Java, FIJI and Plugin
This section is for those users who need to install everything in order to get started.
- Install Java
The very first step that needs to be done is to make sure that the latest version of Java is installed. Follow the steps below to install the latest version of Java.
Download & Install Java Download Here and make sure it was installed correctly.
- Install Fiji
Now that the latest version of Java is installed we can proceed with installing FIJI.
Download the latest version of FIJI Here (Make sure to download the “No JRE” version)
- Install MosaicTool Plugin
Download the latest version of the MosaicTool Plugin Here
**In order to access the MosaicTool plugin, please contact sckefauver@ub.edu for access**
To Install Place the MosaicTool.jar file in Fiji’s plugins folder Fiji.app\plugins
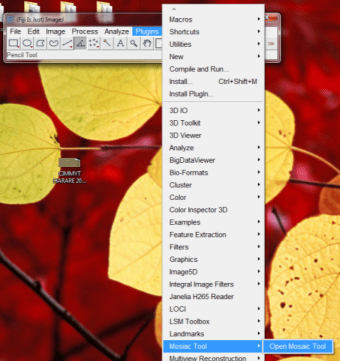
- Start up FIJI and the MosaicTool should appear under the plug-ins menu as in Step 2.
- Go to Plugins – Mosaic Tool – to Open Mosaic Tool under the Plugins drop-down menu as shown below
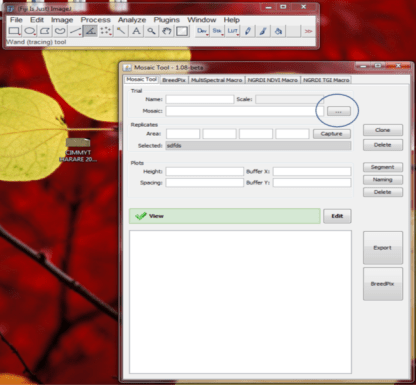
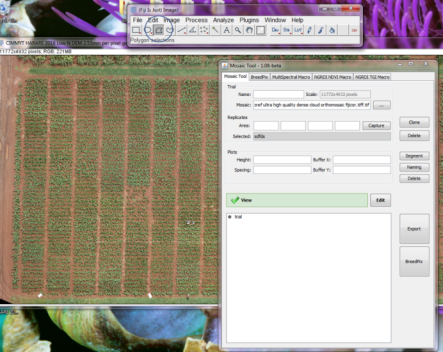
- Once you open plugin, browse to and select to open the mosaic image that needs to be processed (…).
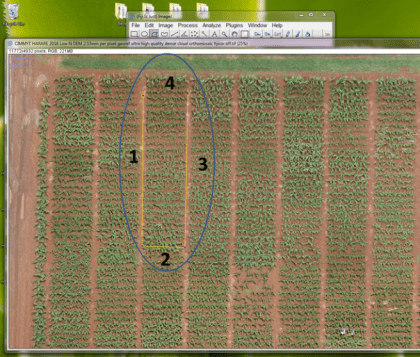
- Once mosaic is open, go to the main FIJI toolbar and select the Polygon tool, and so you can select the area of interest (circled in the image below).
- When drawing the polygon, pay attention to start at the top left corner and select the four corners counter-clockwise, as indicated below. For now this the required order, but it will be refined in future releases.
- When you have finished polygon, select Capture, and the area coordinates will be recorded.
- In order to divide the mosaic area image into plots, fill out the detailed information in the Plots section. Height refers to the height (y) of the plot and Spacing the space that is between plant rows (these are both calculated in pixels, which you may estimate using the FIJI Measurement Tool). The width is taken from the replicate polygon. Buffers will shrink by x and y number of pixels the final bounding boxes for each plot.

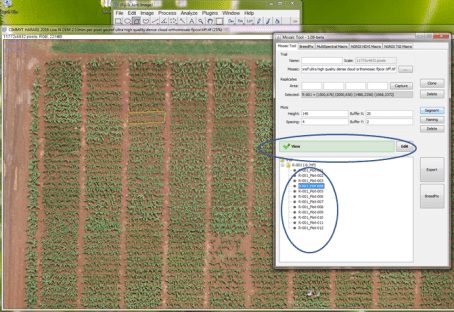
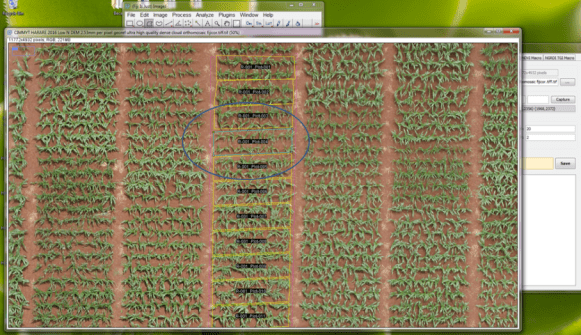
- When you are finished entering all the information, select the area of interest that appears under trial, and click on Segment. In this step the area of interest will be divided as indicated by the plot size details. In this example is needed that it is divided in 12 plots, and information that was previously introduced, divided in that amount, if this does not happen correctly, simply adjust the data in Plots, especially Height.
- If necessary to make manual adjustments to any single plot or group of plots, select the plot of interest and click on Edit, where you can edit all the plots so that they are customized using the FIJI ROI Manager.

- The actively selected plot will turn blueish, indicating that you can edit it.
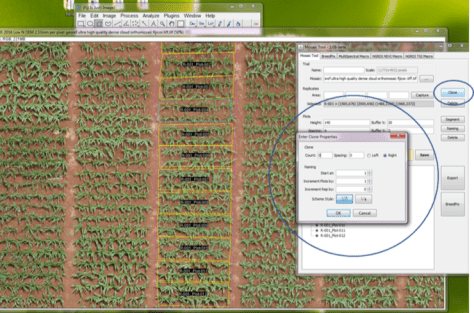
- Once the cutting of one replicate has been perfected for all of the plots, continue with the cloning feature. Click on Clone and a window will open, in which says Clone Count and enter the number of rows that wants you to clone and in Spacing introduce the distance between rows (measured with the same FIJI measurement tool).
- Naming can be used to change the order of the plot naming, whether the plots are serpentine or zigzag, and if there is a special spacing between each replicate number (1001, 2001, etc., or continuous, for example).
- Once everything has been entered, press OK and all of the plots will be renamed according to desired.
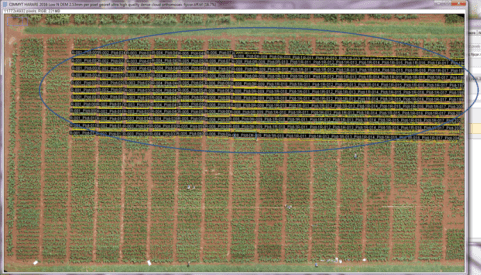
- Zooming out will be shown all of the cloned plots at once, but you may go back to step number 9 if so desired in order to Edit the plots using the ROI Manager, where you may also Save the ROIs as well.
- Once all edited in the ROI Manager, don’t forget to select Save in order to keep the changes.
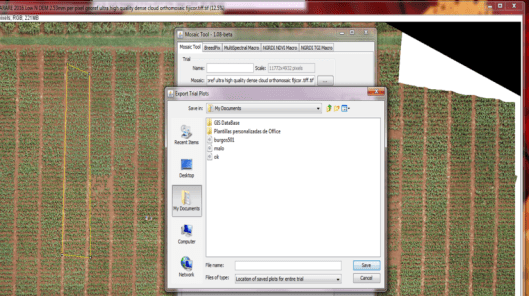
- In the last step there are two options:
- Select Export, and you’ll get your cut plots saved as miniature images in the location of choice.
- If processing RGB images and you don’t want to save the individual plots, it is possible to go directly to processing by clicking on Breedpix, click on CSV Results to indicated where to store the results file and indicate the CSV delimiter. It further has the option to save the images with GA and GGA visualizations to file as well. If using other multispectral or thermal images, then the only option available is to save the plot microraster images first and then use the dedicated processing tab for each sensor type. This two-step process may also be done with RGB images.

Authors
Dr. Shawn Kefauver, Project Principal Investigator, University of Barcelona
Adrian Gracia-Romero, University of Barcelona
Prof. José Luis Araus, University of Barcelona
George El-Haddad, Software Engineer, Postlight
Organizations
Administered by University of Barcelona / Dept. B.E.E.C.A. / Integrative Crop Ecophysiology Group
Funded in part by Spanish MINECO Project AGL2016-76527-R and Juan de la Cierva IJCI-2014-20595
Library Dependencies
The MosaicTool has the following dependencies external to Fiji
Apache Poi https://poi.apache.org/ :Licensed under the Apache License 2.0
TableLayout: http://www.oracle.com/technetwork/java/tablelayout-141489.html
Public Domain: Author: Daniel Barbalace
License
Copyright 2018 Shawn Carlisle Kefauver
Licensed under the General Public License version 3.0
Hosted at Gitlab:
Shawn Kefauver / MosaicTool
(access permission required, email sckefauver@ub.edu for any inquiries)
